
Overview
Our team of four analyzed how ads from Remax, Desjardins, and St-Hubert impact emotions using FaceReader and surveys. We dove into the data with statistical analysis and cross-examination to uncover insights that can help sharpen future ad strategies. It’s a solid study in marketing and consumer behavior.
Our team of four analyzed how ads from Remax, Desjardins, and St-Hubert impact emotions using FaceReader and surveys. We dove into the data with statistical analysis and cross-examination to uncover insights that can help sharpen future ad strategies. It’s a solid study in marketing and consumer behavior.
Approach
Analyzing questionnaire and FaceReader data descriptively.
Using inferential statistics for in-depth insights and cross-data comparison.
Making recommendations and noting limitations.
Analyzing questionnaire and FaceReader data descriptively.
Using inferential statistics for in-depth insights and cross-data comparison.
Making recommendations and noting limitations.
Analysis of FaceReader Data
Analysis of FaceReader Data
Right off the bat, the FaceReader database, with 20,176 observations from 30 participants for Desjardins, REMAX, and St-Hubert ads, revealed 49 insignificant missing values (0.24% of the data) in the St-Hubert set, allowing their exclusion without analysis bias.
Right off the bat, the FaceReader database, with 20,176 observations from 30 participants for Desjardins, REMAX, and St-Hubert ads, revealed 49 insignificant missing values (0.24% of the data) in the St-Hubert set, allowing their exclusion without analysis bias.
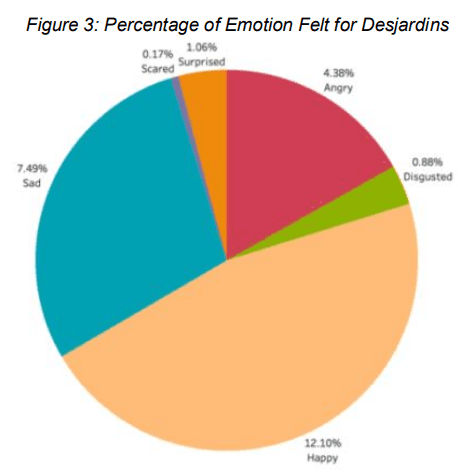
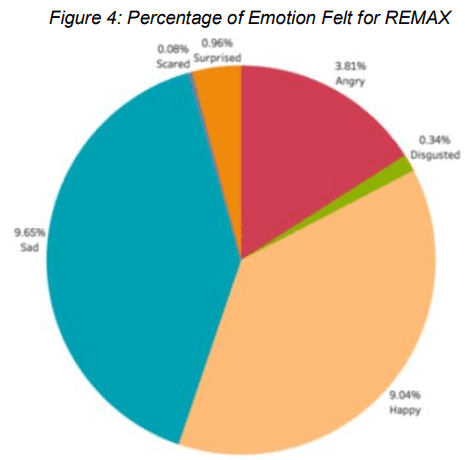
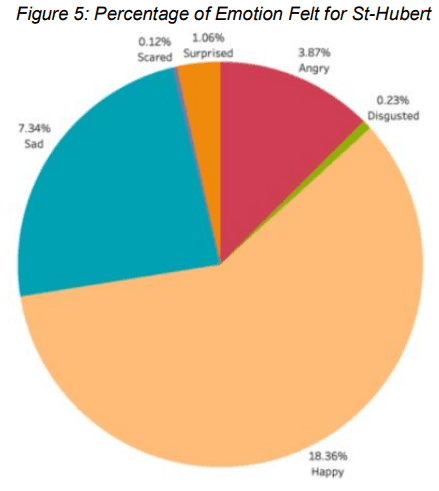
The analysis breaks down emotions for each ad:
Positive: St-Hubert's ad topped happiness at 18.36%.
Negative: Desjardins led in fear (0.17%), disgust (0.88%), and anger (4.38%), while REMAX had the most sadness (9.65%).
Neutral: All ads were close in neutrality, but St-Hubert had the lowest at 62.68% (not shown in graphs).
Surprise: Around 1% across all ads, either positive or negative
Narrative of emotions
Narrative of emotions
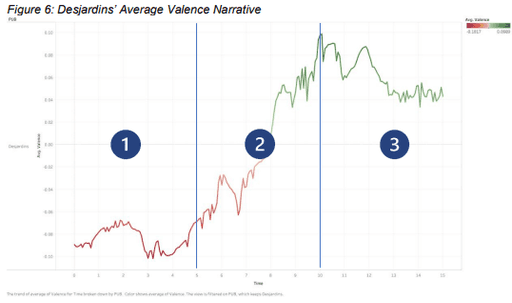
Desjardins:
Initially negative valence, with no discomfort shown by characters.
Transition to neutral as audience reacts to humorous dialogue.
Stabilizes at positive valence with humor appreciation, though dips when the ad's message starts, then peaks again.
Ends with declining valence as audience interest may fade.


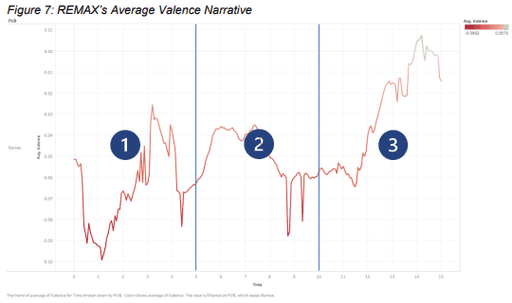
Remax:
Starts with a decrease in valence due to an overwhelming opening.
Gradually improves as audience adjusts.
Fluctuates with changing tones in the dialogue.
Introduction of a new character initially decreases valence.
Jingle brings valence to neutral, lifting emotions.
Ends with a drop in valence due to an awkward handshake.

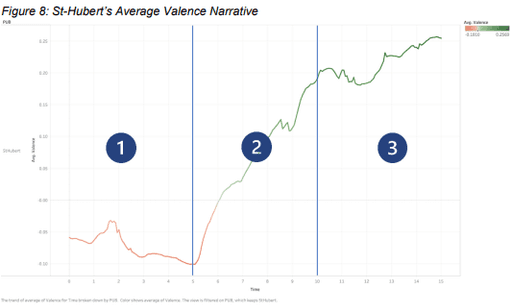
St-Hubert:
Begins with negative valence as the audience is introduced to the celebrity, Sugar Sammy.
Further descent in valence when a second character, the mother, reacts in hysteria to the computer screen, implying unacceptable content.
Valence increases to neutral as Sugar Sammy anticipates clarifying the situation.
A turning point at 7 seconds, where audience anticipation turns to relief upon seeing acceptable content on the screen, raising valence.
Slight dip in valence when Sugar Sammy explains his actions.
Concludes with the highest positive valence, combining Sugar Sammy’s cultural identity, the St-Hubert jingle, and a donation message, positively impacting emotions.

Inferential Statistics
Objective 1:
We aimed to see if adding music or jingles at the end of ads boosts participants' positive emotions. FaceReader data showed a noticeable rise in valence at the end of each video, leading to our hypothesis:
Does music at the end significantly increase overall valence for all participants and across each ad?


To explore how music impacts valence in ads, we created two variables: one for music (0 = no music, 1 = music) and one for valence (per second of the ad). Using SAS for hypothesis testing, we ran an ANOVA with the Satterthwaite method due to unequal variances.
Results showed a significant increase in valence with music (p < 0.001), raising the average by 0.1142. The null hypothesis was rejected, confirming that music in ads boosts valence. Welch’s ANOVA also supported this finding.
Objective 2:
We aimed to determine which ad—St-Hubert, Desjardins, or REMAX—performed best based on key questionnaire variables.
Hypothesis: We hypothesized that one of the ads would score highest on 'PartagePub' (likelihood to share, 1-4 scale), 'VoirPub' (willingness to watch if enforced, 1-5 scale), and 'AimePub' (liking the ad, 1-4 scale).


The analysis showed a significant difference in "PartagePub" (likelihood of sharing) among the ads (p = 0.0214), leading to the rejection of the null hypothesis. Participants were most likely to share the St-Hubert ad, with a 95% confidence interval of 2.2758 to 2.9244, and a mean score difference of 0.0161 compared to the other ads.
The analysis showed a significant difference in "PartagePub" (likelihood of sharing) among the ads (p = 0.0214), leading to the rejection of the null hypothesis. Participants were most likely to share the St-Hubert ad, with a 95% confidence interval of 2.2758 to 2.9244, and a mean score difference of 0.0161 compared to the other ads.
Objective 3: Cross Data Analysis
The study explored the link between average valence, gender, and willingness to share an ad.
Objective: To see if valence differs by gender and relates to the likelihood of sharing an ad.
Variables:
Valence_idpub: Average valence per participant per ad.
Sexe: Gender (1 = Man, 2 = Woman).
PartagePub: Likelihood to share (1 = very likely, 4 = not likely).
Hypothesis: We hypothesized that average valence varies by gender and correlates with participants' willingness to share the ad.
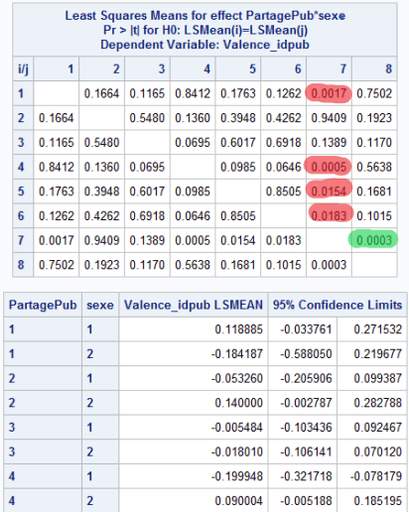

The study found a significant interaction between gender and the likelihood of sharing an ad ("PartagePub") with a p-value of 0.0068. A plot of average valence by gender (men in blue, women in red) supported this finding. The analysis confirmed equal variances (F = 0.2266), emphasizing the gender-ad sharing connection.
The study found a significant interaction between gender and the likelihood of sharing an ad ("PartagePub") with a p-value of 0.0068. A plot of average valence by gender (men in blue, women in red) supported this finding. The analysis confirmed equal variances (F = 0.2266), emphasizing the gender-ad sharing connection.
Conclusion
The analysis found that St-Hubert excelled in key variables, and music in ads generally boosted participant valence. However, women were less likely to share ads despite positive feelings.
Limitations:
Limited demographic info (only gender).
Small sample size (30 participants), risking bias.
Research Process Limitations:
Ignored viewing time, affecting responses.
Pre-existing brand opinions could skew results.
Questionnaire design issues (odd/even scales).
Different industries may introduce bias.
Future research should expand the sample size, diversify demograp ics, consider viewing time, and compare ads within the same industry.
Right off the bat, the FaceReader database, with 20,176 observations from 30 participants for Desjardins, REMAX, and St-Hubert ads, revealed 49 insignificant missing values (0.24% of the data) in the St-Hubert set, allowing their exclusion without analysis bias.


The analysis breaks down emotions for each ad:
Positive: St-Hubert's ad topped happiness at 18.36%.
Negative: Desjardins led in fear (0.17%), disgust (0.88%), and anger (4.38%), while REMAX had the most sadness (9.65%).
Neutral: All ads were close in neutrality, but St-Hubert had the lowest at 62.68% (not shown in graphs).
Surprise: Around 1% across all ads, either positive or negative
Analysis of FaceReader Data
Final Thoughts
Final Thoughts
Inferential Statistics
Objective 1:
We aimed to see if adding music or jingles at the end of ads boosts participants' positive emotions. FaceReader data showed a noticeable rise in valence at the end of each video, leading to our hypothesis:
Does music at the end significantly increase overall valence for all participants and across each ad?
To explore how music impacts valence in ads, we created two variables: one for music (0 = no music, 1 = music) and one for valence (per second of the ad). Using SAS for hypothesis testing, we ran an ANOVA with the Satterthwaite method due to unequal variances.
Results showed a significant increase in valence with music (p < 0.001), raising the average by 0.1142. The null hypothesis was rejected, confirming that music in ads boosts valence. Welch’s ANOVA also supported this finding.


Objective 2:
We aimed to determine which ad—St-Hubert, Desjardins, or REMAX—performed best based on key questionnaire variables.
Hypothesis: We hypothesized that one of the ads would score highest on 'PartagePub' (likelihood to share, 1-4 scale), 'VoirPub' (willingness to watch if enforced, 1-5 scale), and 'AimePub' (liking the ad, 1-4 scale).


The analysis showed a significant difference in "PartagePub" (likelihood of sharing) among the ads (p = 0.0214), leading to the rejection of the null hypothesis. Participants were most likely to share the St-Hubert ad, with a 95% confidence interval of 2.2758 to 2.9244, and a mean score difference of 0.0161 compared to the other ads.
Objective 3: Cross Data Analysis
The study explored the link between average valence, gender, and willingness to share an ad.
Objective: To see if valence differs by gender and relates to the likelihood of sharing an ad.
Variables:
Valence_idpub: Average valence per participant per ad.
Sexe: Gender (1 = Man, 2 = Woman).
PartagePub: Likelihood to share (1 = very likely, 4 = not likely).
Hypothesis: We hypothesized that average valence varies by gender and correlates with participants' willingness to share the ad.


The study found a significant interaction between gender and the likelihood of sharing an ad ("PartagePub") with a p-value of 0.0068. A plot of average valence by gender (men in blue, women in red) supported this finding. The analysis confirmed equal variances (F = 0.2266), emphasizing the gender-ad sharing connection.
Conclusion
The analysis found that St-Hubert excelled in key variables, and music in ads generally boosted participant valence. However, women were less likely to share ads despite positive feelings.
Limitations:
Limited demographic info (only gender).
Small sample size (30 participants), risking bias.
Research Process Limitations:
Ignored viewing time, affecting responses.
Pre-existing brand opinions could skew results.
Questionnaire design issues (odd/even scales).
Different industries may introduce bias.
Future research should expand the sample size, diversify demographics, consider viewing time, and compare ads within the same industry.
I truly enjoyed this project; the challenges and statistical analysis were engaging. It sparked my interest in Quantitative User Experience, sharpening my analytical skills and passion for how data influences design and decision-making. This experience marked a pivotal shift in my career.

Narrative of emotions
Desjardins:
Initially negative valence, with no discomfort shown by characters.
Transition to neutral as audience reacts to humorous dialogue.
Stabilizes at positive valence with humor appreciation, though dips when the ad's message starts, then peaks again.
Ends with declining valence as audience interest may fade.


Remax:
Starts with a decrease in valence due to an overwhelming opening.
Gradually improves as audience adjusts.
Fluctuates with changing tones in the dialogue.
Introduction of a new character initially decreases valence.
Jingle brings valence to neutral, lifting emotions.
Ends with a drop in valence due to an awkward handshake.


St-Hubert:
Begins with negative valence as the audience is introduced to the celebrity, Sugar Sammy.
Further descent in valence when a second character, the mother, reacts in hysteria to the computer screen, implying unacceptable content.
Valence increases to neutral as Sugar Sammy anticipates clarifying the situation.
A turning point at 7 seconds, where audience anticipation turns to relief upon seeing acceptable content on the screen, raising valence.
Slight dip in valence when Sugar Sammy explains his actions.
Concludes with the highest positive valence, combining Sugar Sammy’s cultural identity, the St-Hubert jingle, and a donation message, positively impacting emotions.


Final Thoughts
Final Thoughts
Final Thoughts
I truly enjoyed this project; the challenges and statistical analysis were engaging. It sparked my interest in Quantitative User Experience, sharpening my analytical skills and passion for how data influences design and decision-making. This experience marked a pivotal shift in my career.


I truly enjoyed this project; the challenges and statistical analysis were engaging. It sparked my interest in Quantitative User Experience, sharpening my analytical skills and passion for how data influences design and decision-making. This experience marked a pivotal shift in my career.


